Unite stands for both successful business and transparency. Together with our partner Yook, we’ve built a user-friendly way to visualise the carbon footprint of orders placed on Unite. With just a few clicks, you can download CO2 reporting data for your company’s entire order history.
This feature will simplify your reporting in a way that’s compliant with the GHG Protocol Scope 3 and the Corporate Sustainability Reporting Directive (CSRD) and significantly reduce the time you spend on data collection and processing.
Contents
Accessing the CO2 report
Log in to your account, go to ‘My Mercateo’ and click on the ‘Order archive’ tab.
In the order archive click on ‘NEW extended report’.
Log in to the new interface with your existing login data. Alternatively go directly to Link: https://upp.unite.eu/en-de/order-history and log in.
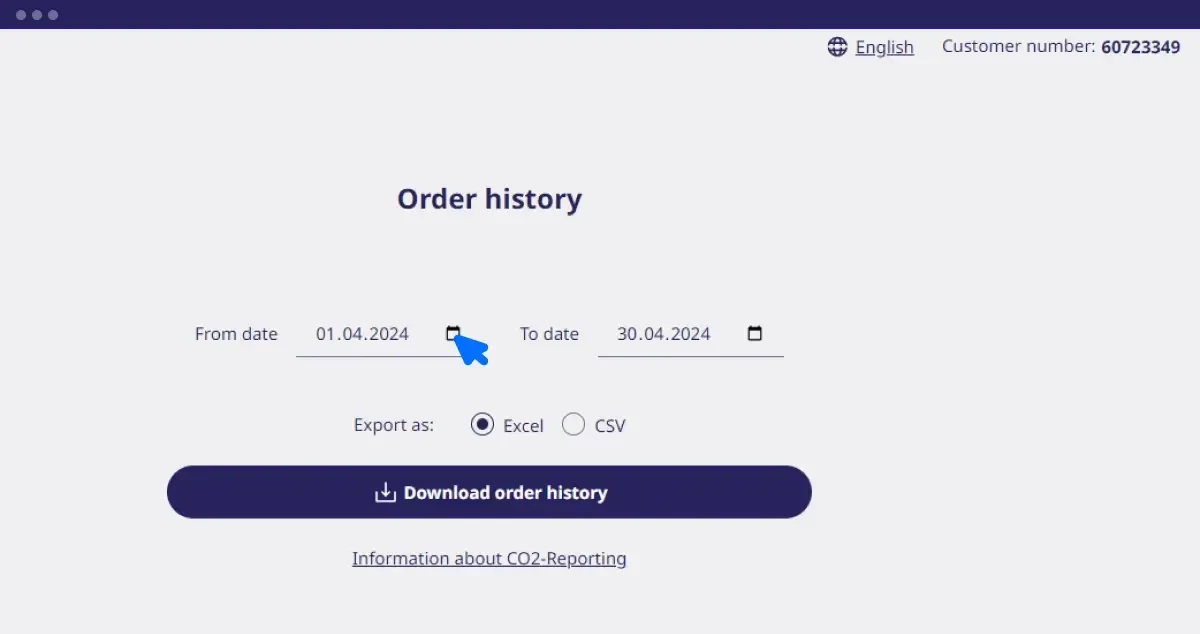
Now you can select the desired time period and file format.
Click on the ‘Download order history’ button. You’ll see a confirmation pop-up once the download is complete.
Analysing and interpreting the CO2 report
Total CO2 emissions
Open the export to access the greenhouse gas emissions data of your orders. The AC column lists the total CO2 emissions for each order in kilograms.
Don’t be confused by the term ‘CO2e data’ that appears later. This refers to greenhouse gases being measured in CO2 equivalents. To correctly interpret the data, first filter out any cancelled or unknown orders (Go to ‘Order status’ in column A – ‘Cancelled’ or ‘Unknown’). You can then use the result for your carbon accounting.
It’s important to note that the entries for freight costs don’t include CO2e data specific to product groups. This is because there is no direct correlation between prices and the greenhouse gas emissions of individual deliveries.
Data accuracy value
The AD column contains the data accuracy value. It ranges from 0 to 90. The higher the value, the better the quality of the data. Further details can be found in ‘Unite CO2 Reporting Method, version 1.0’ below.
Assigning permissions to users
Initially, only the account owner has access to the extended order report that includes CO2 data.
Depending on the solution setup access can be granted to other users as follows:
Multi User Solution Setup
Grant access to other users of your organisation by adapting their permissions.
For this go to User Management > User Settings > Rights and activate Download the order report for all orders. Now these users can view and access the extended report for all order placed within your organisation.
Punchout Solution Setup
Currently, only account owner can access the advanced order report and share the file within their organisation if needed.
Unite CO2 Reporting Method, version 1.0
How to quickly and accurately measure greenhouse gas emissions
You can determine the greenhouse gas emissions of the goods you’ve purchased on Unite quickly and accurately. In a pilot study, Yook and Unite have developed a method enabling you to see the greenhouse gas emissions of any order item at the click of a button. Behind this simple click is a streamlined data collection process for carbon reporting that complies with the GHG Protocol Scope 3 and the Corporate Sustainability Reporting Directive (CSRD).
How to use the CO2 data provided
Utilise the data in accordance with the Greenhouse Gas Protocol Scope 3.1 for your CO2 accounting. This allows you to measure the impact of your purchased goods on your corporate carbon footprint. This method calculates the company’s own and all other relevant greenhouse gas emissions along the value chain.
You benefit from:
Good data availability for C-parts
Easier data collection
Quick results for extensive product portfolios or order histories
Well-documented methodology
The following section explains why you can’t (yet) compare the data sets of two products.
Product Carbon Footprint (PCF) method:
The aims of this method are twofold: firstly, to provide Unite customers with all crucial emissions data for goods and services purchased, and secondly, to integrate specific data that will enable future product comparison.
The CO2e data in Version 1.0 relies on a spend-based carbon accounting approach. In this method, each euro spent is assigned a CO2e intensity factor per product group.
Unite CO2 Reporting V1.0 provides cradle-to-gate emissions data for the goods and services purchased. Cradle-to-gate means data collection from the extraction of raw materials to the production of a finished product. It also includes intermediate transport and manufacturing processes. However, it doesn’t cover shipping, usage, or end-of-life phases.
If you’re comparing greenhouse gas emissions data over a prolonged period, it’s important to note that the results of the PCF method can fluctuate with price changes.
One reason why product group-based data isn’t suitable for product comparison is that it’s not calculated for specific items and varies from one supplier to the next. To nevertheless enhance comparability, Unite will gradually integrate manufacturers’ PCF data.
Details for data reference
Please cite the data as ‘Unite 2024, CO2 Reporting Version 1.0’ and ensure you always use the most recent version. Add the timeframe of your order data. Bear in mind that Yook sources CO2 factors from European databases, primarily ADEME’s Base Empreinte V23.0.
The Data Accuracy Score helps you combine your Unite CO2 reporting data with other data sources. The scale ranges from 0 to 90, with 90 representing the highest data quality. To track improvements in data quality, we recommend including the Data Accuracy Score in your reporting.
The Yook safety margin compensates for statistical uncertainties to prevent underestimating greenhouse gas emissions when data accuracy is low. The safety margin correlates with the Data Accuracy Score. The calculated CO2 footprint of a product is multiplied by the score. Please note this when combining different PCF data sources.
| Data quality | Data Accuracy Score | Method for calculating the carbon footprint | Method description | Safety margin |
|---|---|---|---|---|
| very low | 1-3 |
Spend-based PCF, supplier-specific, cradle-to-gate | Average CO2e factor for all product categories sold by a retailer per euro, multiplied by the product price. |
1.5 |
| low | 4-20 |
Spend-based PCF, category-specific, cradle-to-gate | Product category-specific CO2e factor per euro, multiplied by the product price. | 1.5 |
| medium | 21-40 |
Average data PCF, cradle-to-gate | Average LCA-based PCF value per unit purchased for a product category. | 1.4 |
| elevated | 41-60 |
Supplier-specific PCF, cradle-to-gate | Supplier-specific PCF value per unit purchased for the specific product. | 1.3 |
| high | 61-80 |
Supplier-specific PCF, cradle-to-gate | Supplier-specific PCF value per unit purchased for the specific product. | 1.2 |
| very high | 81-90 |
Supplier-specific PCF, cradle-to-gate | Supplier-specific PCF value per unit purchased for the specific product. | 1.1 |
| - | 91-100 |
Supplier-specific PCF, cradle-to-gate | Not achievable as no model perfectly reflects reality | - |
| Data quality | very low |
| Data Accuracy Score | 1-3 |
| Method for calculating the carbon footprint | Spend-based PCF, supplier-specific, cradle-to-gate |
| Method description | Average CO2e factor for all product categories sold by a retailer per euro, multiplied by the product price. |
| Safety margin | 1.5 |
| Data quality | low |
| Data Accuracy Score | 4-20 |
| Method for calculating the carbon footprint | Spend-based PCF, category-specific, cradle-to-gate |
| Method description | Product category-specific CO2e factor per euro, multiplied by the product price. |
| Safety margin | 1.5 |
| Data quality | medium |
| Data Accuracy Score | 21-40 |
| Method for calculating the carbon footprint | Average data PCF, cradle-to-gate |
| Method description | Average LCA-based PCF value per unit purchased for a product category. |
| Safety margin | 1.4 |
| Data quality | elevated |
| Data Accuracy Score | 41-60 |
| Method for calculating the carbon footprint | Supplier-specific PCF, cradle-to-gate |
| Method description | Supplier-specific PCF value per unit purchased for the specific product. |
| Safety margin | 1.3 |
| Data quality | high |
| Data Accuracy Score | 61-80 |
| Method for calculating the carbon footprint | Supplier-specific PCF, cradle-to-gate |
| Method description | Supplier-specific PCF value per unit purchased for the specific product. |
| Safety margin | 1.2 |
| Data quality | very high |
| Data Accuracy Score | 81-90 |
| Method for calculating the carbon footprint | Supplier-specific PCF, cradle-to-gate |
| Method description | Supplier-specific PCF value per unit purchased for the specific product. |
| Safety margin | 1.1 |
| Data quality | - |
| Data Accuracy Score | 91-100 |
| Method for calculating the carbon footprint | Supplier-specific PCF, cradle-to-gate |
| Method description | Not achievable as no model perfectly reflects reality |
| Safety margin | - |


